Its six months now since I had my solar panes, inverter and battery storage system installed, and i wanted to let you know how we are getting on.
Firstly i best put you in the picture of the system we installed, we have 14 450w black solar panels, which are actually installed on our shed roof rather than the house as the roof on the house is pitched east / west not north south (we do intend to add more panels on the main roof later).
Our panels are connected in two strings to a Fox ESS Single phase H1 series 5.6kw hybrid inverter which is in turn connected to the grid and too our Fox energy cube storage batteries which when initially installed was one battery and one master and one slave battery giving 5.76kw but have since been upgraded to 14.4kw with the addition of three more slaves.
The additional batteries were added over winter once we saw how the system performed and also to maximise our savings due to the way the Octopus Energy tariffs work.
There is still some work to do one the system to get the most out of it, and one of those involves removing a tree in our garden and relocating some of our solar panels, and also adding angled mounting brackets to lift the panels so they sit around 30 degrees from the horizontal rather than flat an pointing straight up.
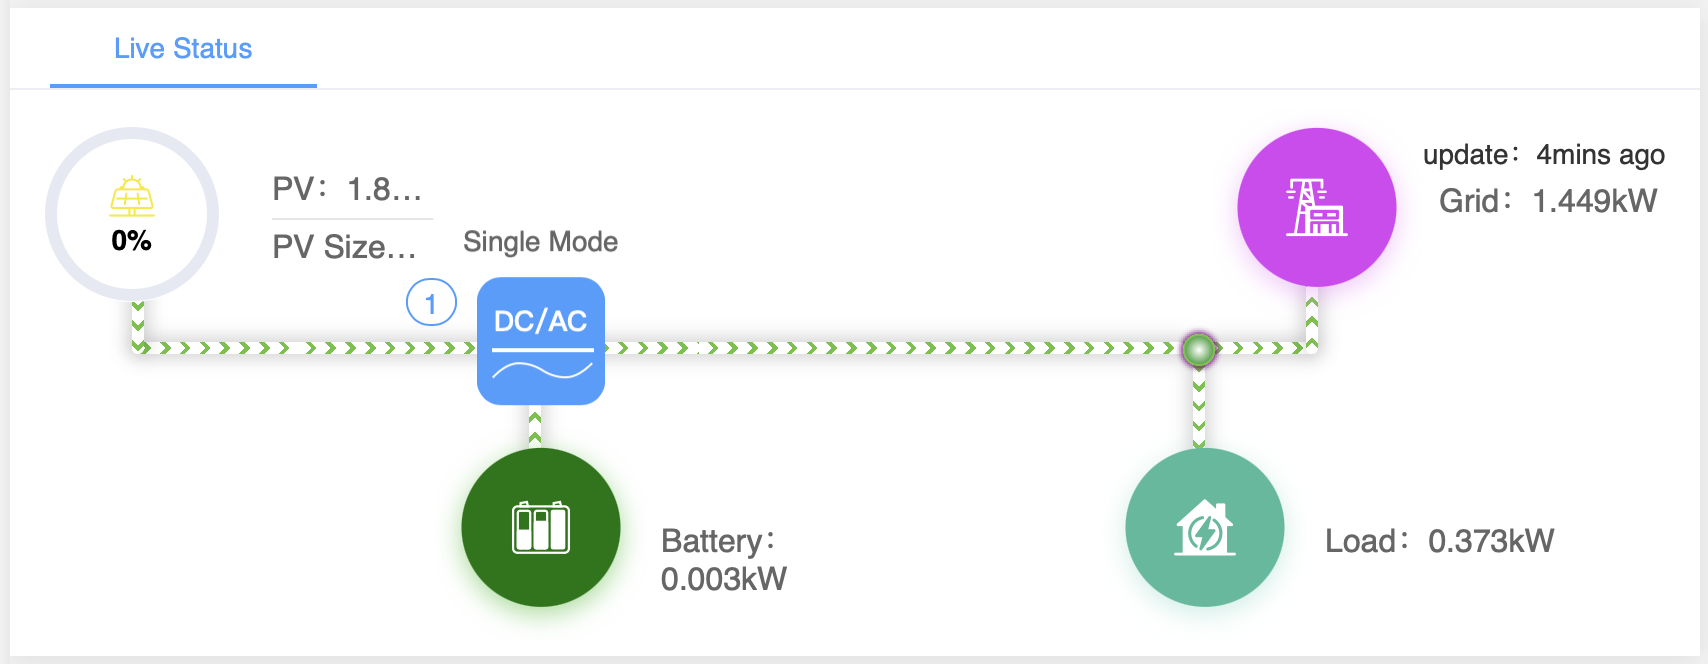
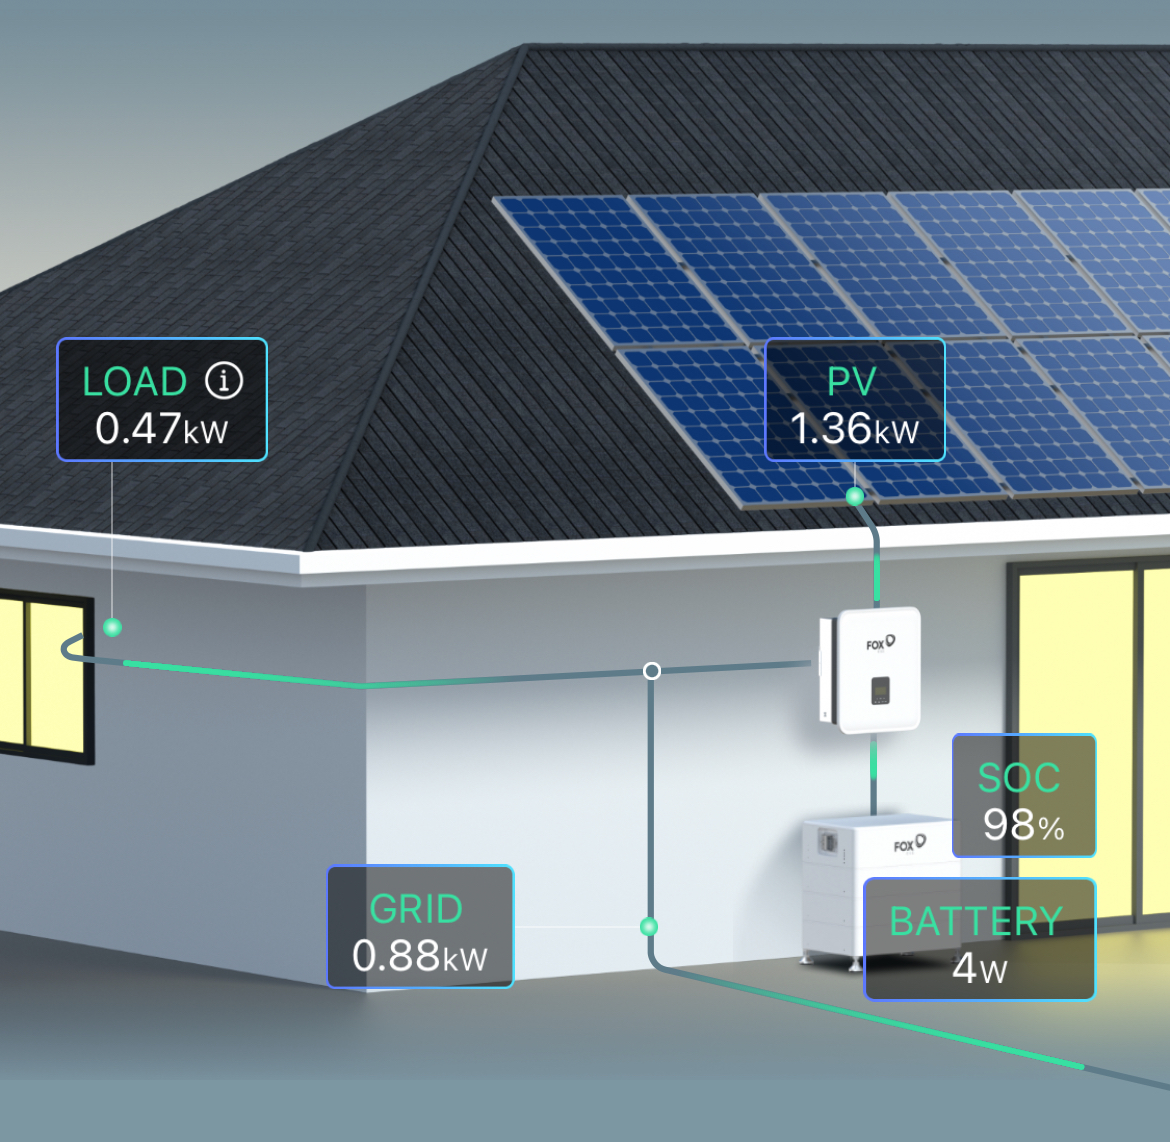
The image above shows the status of our system at 09:00am on the day i wrote this piece, and yes it was a lovely sunny April morning, but as you can see the batteries are fully charged, the solar panels are taking the load from the house (0.37kw) and the rest of the solar production (1.8kw) is being exported to the grid (1.44kw). On a day like today the system will easily cover any load I put on it via the solar panels and i will be selling power to the grid for most of the day.
The image btw comes from the FoxEss Cloud Website which you can access from any web browser to monitor and adjust your system settings.
Our System So Far:
So how did our system start out, we initially purchased and had out system fitted via Project Solar UK, and whilst i thank them for their efficient service in installing the system looking back now I think we did overpay somewhat for the actual system we got, and when we had an initial fault with the system tripping the breakers on the house, they weren’t exactly the fastest in getting out and sorting the issue.
Project Solar UK as far as I can make out are a middle man, and farm out their installs etc to local installers, now this isn’t necessarily a bad thing, and i the same way alot of the energy companies and other national installers work. But what it did do is get us up and running.
When the system was first installed we had a 5.6kw battery which we very very quickly realised was no where near enough. especially heading into winter.
We had out system connected to Octopus Energy on their Octopus Cosy Tariff which provides two 3 hour cheap rate charging slots per day, one between 04:00 and 07:00 and the other between 13:00 at 16:00 just prior to the evening peak. The original 5.6kw battery would only just get us through the evening peak and therefore we would be buying standard rate rather than cheap rate power during the day and at night.
We soon upgraded out batteries initially by adding extra 2.6kw slave from Glenfield Electrical (a local installer) and then having seen how easy they were to install we purchased two more slaves from James Meggison at Sunvolt (a company i highly recommend) and we fitted these two additional slaves ourselves (10 minute job).
The Data:
Luckily Octopus allows you to scroll back through your usage in a fairy detailed manor, so i have included some charts for you below so you can see usage across winter.
The first graph is our electricity imports from the grid, the data is monthly from the 1st october though to the 18th April. We extended out battery pack by an extra 2.8kw on the 9th January and then added another 5.6kw on the 5th February, so you do need to read that information into the data and interestingly it is not so much the amount of power used that change with additional batteries but the costs associated with that energy consumption, Sadly i couldn’t get a graph out of Octopus to show this information so I have done a bit of work from my bills and jotted it into a spreadsheet to try and show you the difference.
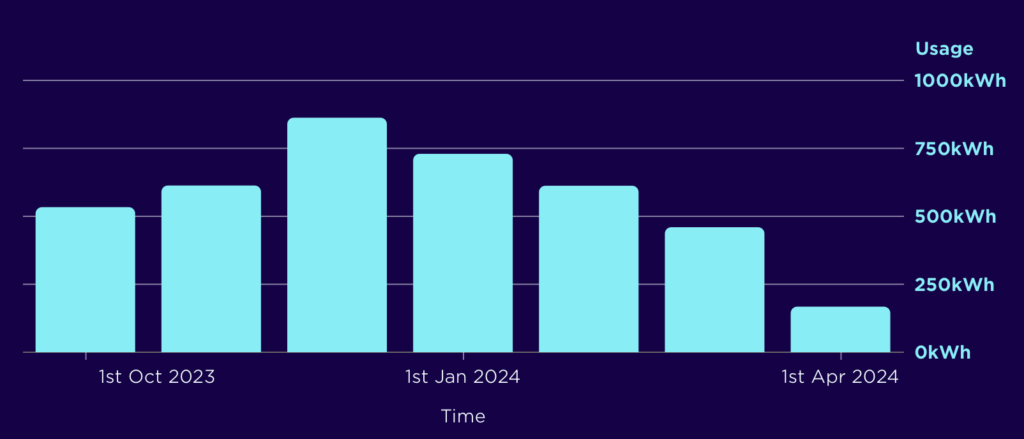
So you can see above exactly what you would expect to see given the data only goes back to 1st October it doesn’t show how much power we used in August / September before the solar panels were fitted, but it probably wouldn’t be relevant anyway what you really need to see is the same period last year, which at some point i will dig out and add in.
The major change we made that was made during this period was the addition of batteries to the system starting out with 5.6kw, adding in an additional 2.8kw on the 9th Jan and then adding in another 5.6kw on the 5th Feb, If you look at the 3 graphs below these show the state of charge of the batteries in those periods..
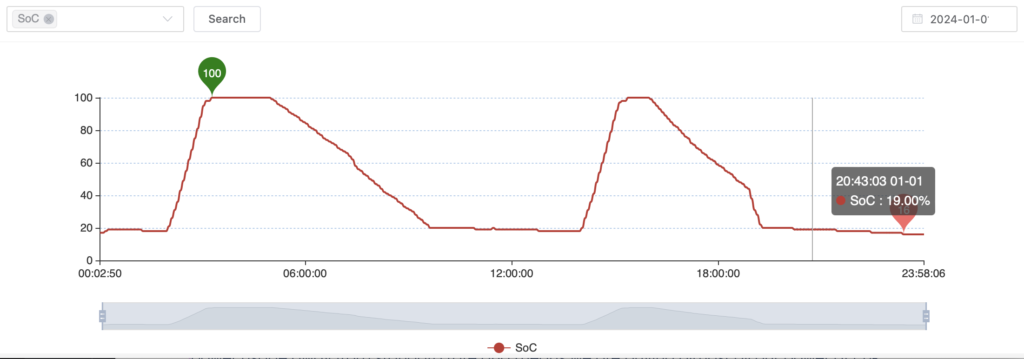

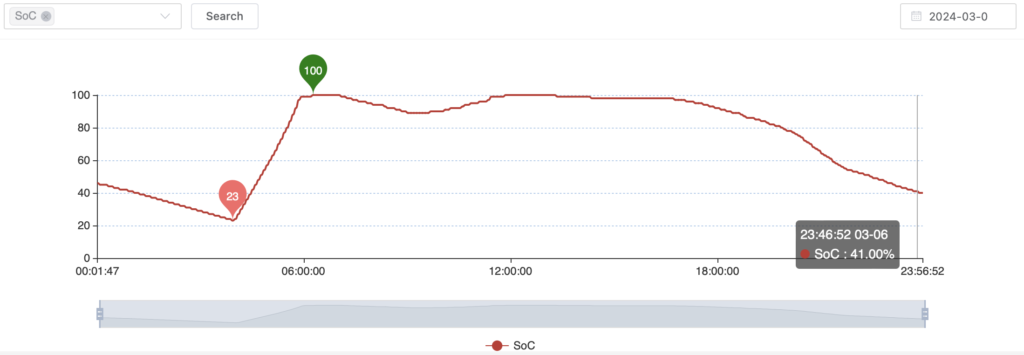
So what your are seeing in the 3 graphs above is as follows:
- 1st Jane – 5.6kw Battery only just hold enough power to get us past the peak power period in the evening (this is the highest cost time to be buying from the grid).
- 4th Feb – 8.4kw Battery we go easily past the peak power period but resume buying from the grid at around 8 / 9 pm (standard rate)
- 6th Mar – 14.4kw Battery easily goes from the peak though to 4am when we start the next cheap rate period. So all power si purchase at cheap rate and we do not touch the grid for importing power at any other time.
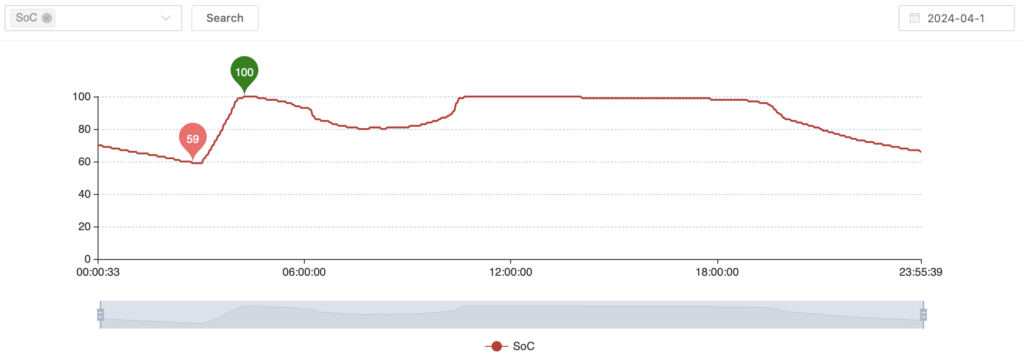
In the final graph it is helped slightly by the evenings getting a little lighter but not significantly, however certainly you can see the effect of the solar panels charging the battery during the as we come into spring, meaning we don’t use as much power during the day, and therefore need to charge up less in the afternoon charging period. If you look at the same graph for a reasonably sunny day in April you can really see the effect the solar panels have on the battery charging., the really interesting think to look at here is the amount of power remaining in the batteries when we get to the 4am cheap rate charging slow, meaning we have only used 40% of the battery overnight. and during the day the battery is largely charged from the solar panels, so we are not only reducing the price we pay for any power we do buy, but we are also starting to reduce the amount we buy, and also starting to sell reasonable amount back to the grid.
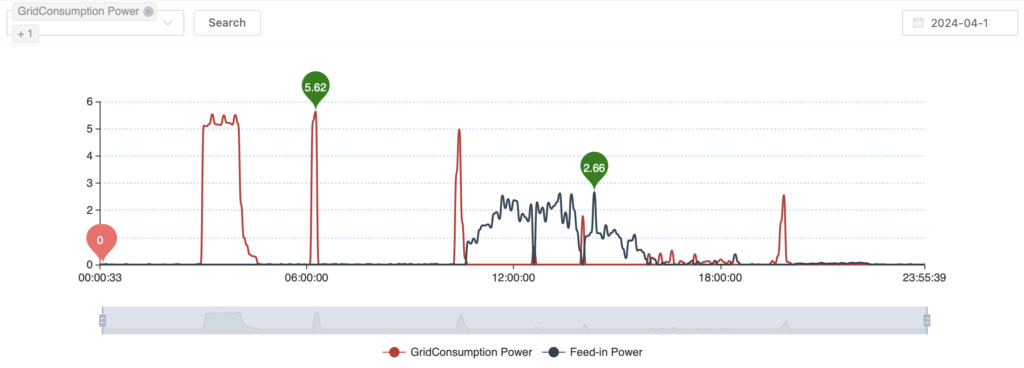
The graph above showers power being consumed from the grid (the red line) and power being exported back to the grid (the blue line)
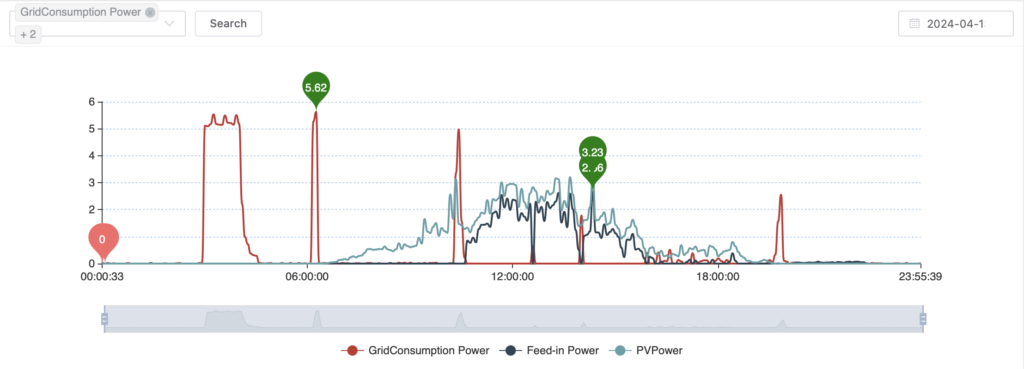
You can clearly see the early morning charging period, and then around 06:00 there is a peak for the 10kw electric shower (only 5kw is provided by the grid, the battery provides the rest), and the shower is used again at around 10am. you can then see the power starting to come in from the solar panels and if you overlay both the battery graph and the power graph you will see that power directly corresponding to the batteries becoming fully charged, keep in mind this only shows power sold to the grid not the total power produced. If you look below I have included the same graph again but this time I have overlayed PV Power (actual power produced by the solar array).
Now if you look below you will see the cost of that power, keep in mind we extended the batteries on the 9th Jan and again on the 5th February. Which has a massive impact on the cost of consumption as it shifts our power usage away from standard rate and means we are buying almost all our power at cheap rate.
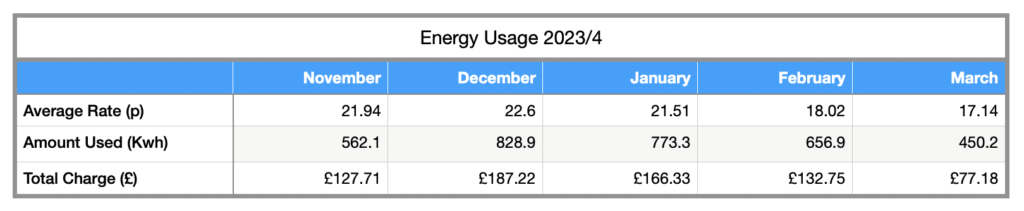
So the figures above are showing us 2 things.
- The average unit cost drops as we add more battery and we shift more of our power usage onto the cheap rate period and away from the standard and peak rate periods.
- As we start to come into march the solar panels are making a significant difference by charging the battery for us during the day, meaning we are buying less power going into the evening peak session.
As soon as I have my April bill I will update this table to include the figures as it is only really in this period that we have managed to keep the battery from draining down to 20 / 30% overnight meaning we also buy less power in the early morning charging session, as-well as needing to purchase very little in the afternoon due to the solar panels charging the system during the day.
Below you can see the solar export payments I have so far received from Octopus covering the same months as above.
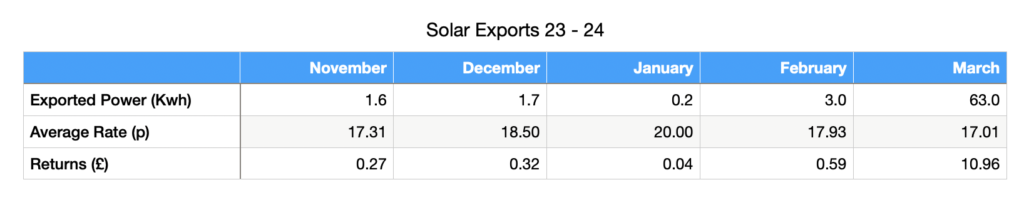
Now, looking at the above you have to think is it worth having solar panels, but what you need to remember is most of the time the solar panels are either charging the batteries or reducing the load, or both, it is not until we reach the longer and obviously brighter days in March that we start to see any worth while return from selling power back to the grid, but what is worth noting is that the average rate paid by Octopus is actually higher or roughly the same as the rate i pay to import power.
But remember this is power i didn’t use in my system if you look at my import for March you see a significant drop in usage and a good chunk of that is down to the solar panels charging the batteries, rather than taking power from the grid.
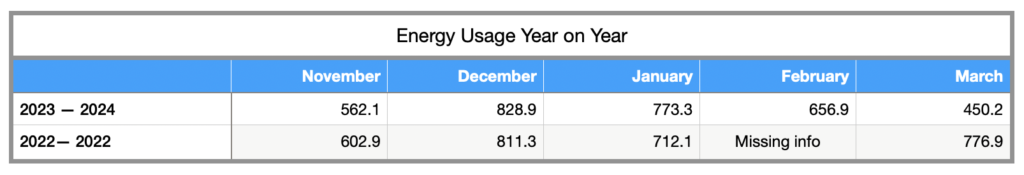
The above figure show my previous years energy consumption verses this year, now interestingly my over usage has increased, this is probably down to me adding an air 2 air heat pump to the house, but the interesting numbers are the November and March figures (sadly i cannot access my figures for Feb 2023. but what the November and March figures do show (more so March) is a significant decrease in usage, and this is attributed to the power generated by the solar panels to both run the household load and charge the batteries (meaning we take less from the grid to charge up). As we go into the summer I would expect this to become even more significant.
So thats the numbers what else do we need to know:
There are a couple of more things you need to know if your looking into installing a FoxESS Inverter and Battery system.
- There is a FoxCLoud Website (which i breifky mentioned above, and from which all my graphs are taken) which allows you to monitor and adjust your system parameters.
- Octopus Intelligent does not yet support FoxESS systems, however you can configure your system to read time and price data from the Octopus API and that can then be used to trigger charging and discharging of your batteries etc (this is something i do not currently do).
- There are two really good mobile apps to support your system the first being the official FoxEss FoxCloud 2.0 app and the second is called Energy Stats both are really good for monitoring, although Energy Stats is probably the better app for actually controlling and adjusting setting on your system.
In Conclusion:
So what are my own thoughts so far on the system and wether or not its worth it, personally i think yes, for a number of reasons, we installed the system before winter so the only real benefit over winter came from the batteries and shifting the load, and now I have re-sized the battery pack to be more of a realistic size it is proving its worth in reducing out cost per kwh from around 22p per kwh to around 17p per kwh.
Then as we are starting to get a little more sun, I am starting to see the solar panels proving their worth, i would expect this to get better as we head into summer, and I will also be adding angled brackets to the panels to optimise their production.
So from my own personal perspective I feel the system is worth it, yes the ROI is pretty long but apart from the monetary value, it means I am also doing my bit to help reduce carbon emissions which has to be a good thing.
Lets see what the next six months brings, I shall of course report back when we have more data to look at.

